Walk-Forward Analysis, Explained — With a Real NinjaTrader Strategy
Published 2026-07-20 · AlgoCrucible
Every trader who has optimized a strategy has felt the suspicion: these settings look great, but would they have looked great if I'd picked them a year ago? Walk-forward analysis is the standard way to answer that question honestly. This article explains what it does, how to read its results, and what it can't tell you — illustrated with a real NinjaTrader 8 strategy run through a walk-forward test.
The problem walk-forward solves
When you optimize a strategy, the optimizer searches history for the settings that would have performed best. That's the problem: it always finds something. Give an optimizer enough parameters and enough combinations and it will produce a beautiful backtest from pure noise — not because the strategy has an edge, but because some combination always fits the past.
A backtest of optimized settings is therefore not evidence the strategy works. It's evidence the optimizer works.
The honest question is different: if you had picked settings using only the data available at the time, would they have kept working on the data that came next? That's what walk-forward analysis simulates.
How walk-forward works
Walk-forward splits history into a series of rolling windows. In each window:
- Train: the optimizer picks the best settings using only that window's data — say, 120 days.
- Test: those settings then trade the following period — say, the next 30 days — which the optimizer never saw.
- Roll forward and repeat, across the whole data set.
The performance that counts is the pooled result of all the test periods — trades made exclusively on data the settings were never fitted to. It's as close as a simulation gets to "what if I had re-tuned this strategy every month, honestly?"
Reading the result: degradation is normal, collapse is the verdict
Here's a real example — a NinjaTrader 8 strategy (goADXMALinReg on MNQ) run through an eight-window walk-forward:
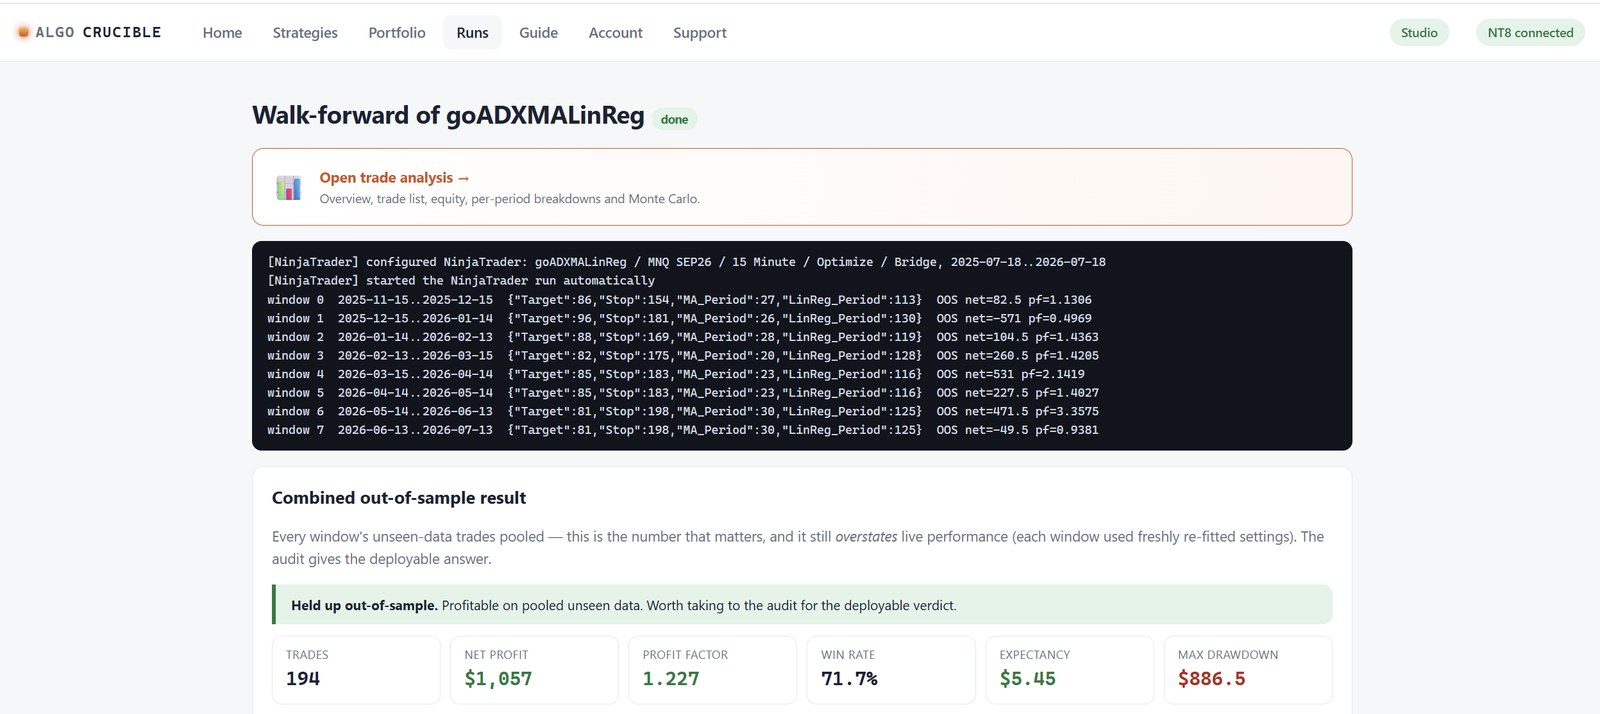
The optimizer's in-sample search had found a profit factor of 1.407. The pooled out-of-sample result: profit factor 1.227, still profitable across 194 unseen-data trades.
That drop is not a failure — it's the expected cost of honesty. In-sample results always flatter, because the settings were chosen because they fit that data. A modest degradation with the edge intact is what a real strategy looks like. What failure looks like is different: the out-of-sample result collapses to breakeven or worse, meaning the "edge" was an artifact of the fitting.
Rules of thumb when reading a walk-forward:
- Expect the out-of-sample numbers to be worse than the optimization's. If they're better, be suspicious of the test setup.
- Judge only the pooled out-of-sample result. Individual windows are noisy; one bad window out of eight is normal.
- Too few trades means no verdict. A handful of out-of-sample trades can't distinguish edge from luck, no matter how good they look.
The overlooked half: parameter stability
Walk-forward produces a second, underrated diagnostic: what settings did each window choose?
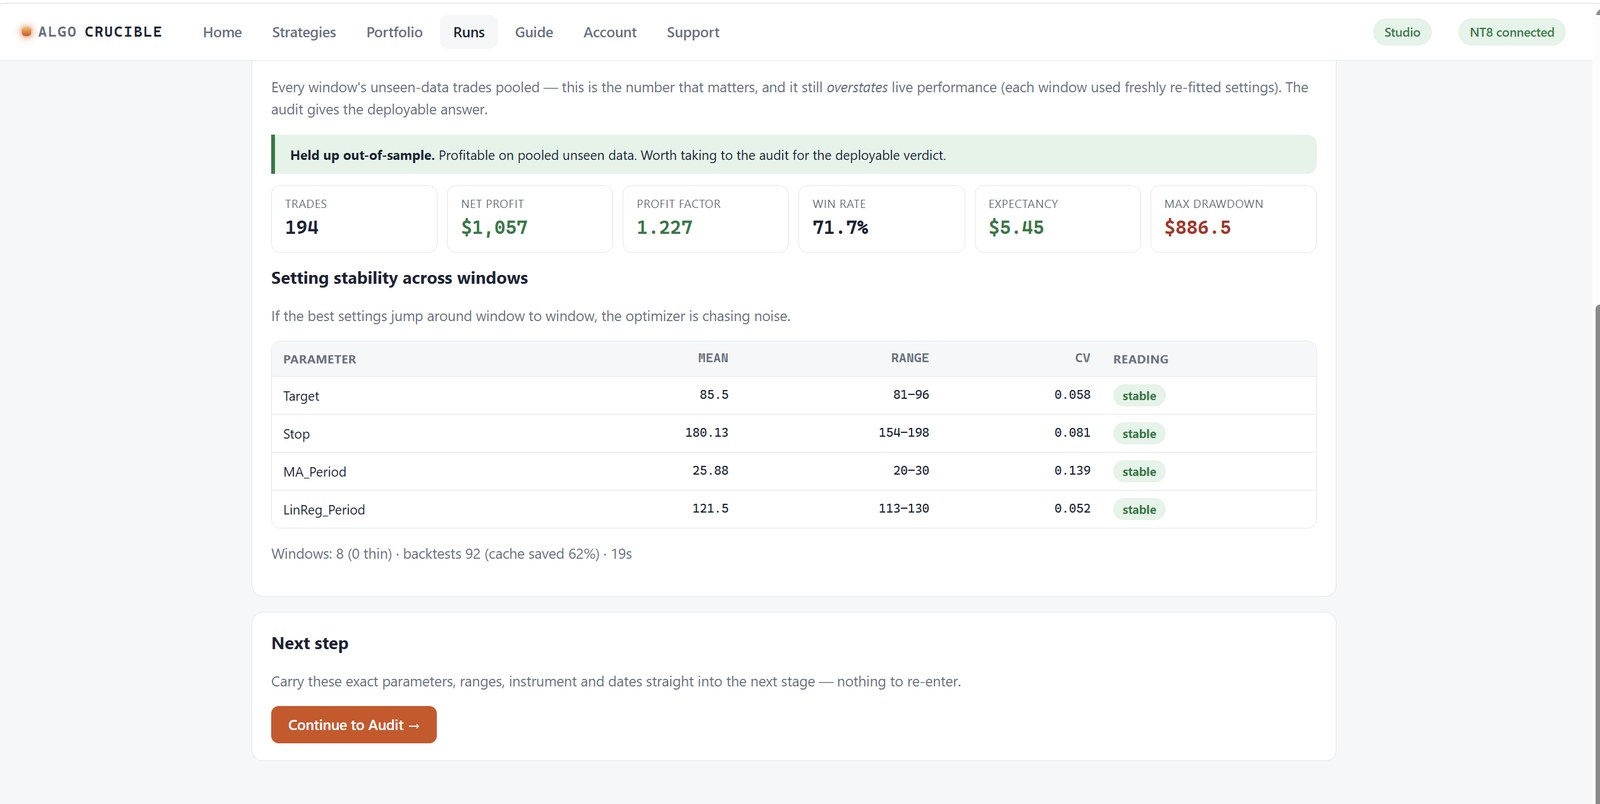
If the "best" settings jump wildly from window to window — a stop of 40 here, 180 there — the optimizer is chasing noise, and no single deployable setting exists. If they stay in a tight band (the example above graded all four parameters stable), the strategy expresses a consistent, repeatable relationship with the market. Stability is often more informative than the performance number itself.
What walk-forward still can't tell you
Walk-forward is necessary, not sufficient. Two caveats matter:
- It still overstates live performance, because every window trades freshly re-fitted settings. Live, you'll deploy one fixed set. Testing that fixed set on separate unseen periods is a distinct step (an audit) that comes after walk-forward.
- It says nothing about parameter sensitivity or sequencing luck. A setting can pass walk-forward and still sit on a knife edge where a small drift breaks it, and a good trade sequence can hide drawdown risk that a reshuffle (Monte Carlo) exposes.
Walk-forward is one gate in a longer funnel: optimize → walk-forward → fixed-set audit → perturbation → Monte Carlo → and, if the goal is a prop-firm evaluation, a rules-based certification.
Common questions
How many windows do I need? Enough that the pooled out-of-sample result has a meaningful trade count — as a rough floor, 6–8 windows and 100+ out-of-sample trades. Fewer than that and the verdict is noise.
Anchored or rolling windows? Rolling (fixed-length train window) adapts to regime change and is the common default. Anchored (train window grows from a fixed start) uses more data per window but lets ancient history vote on current settings.
What ratio of train to test? Typical is 3:1 to 5:1 (e.g., 120 days train, 30 test). Short test windows re-tune often but produce noisy per-window stats; long ones risk staleness.
Want to see the full journey — this same strategy going from raw optimization through walk-forward, audit, perturbation, Monte Carlo, and a prop-firm certification? Read the illustrated walkthrough or explore the Help Center. AlgoCrucible runs this entire pipeline against NinjaTrader 8's own backtest engine — download it free.