A complete, real walkthrough of AlgoCrucible's six-stage validation funnel — every
screenshot below is from one actual NinjaTrader 8 strategy (goADXMALinReg on MNQ)
going from first optimization to a printable certification report.
Before you read the numbers: everything below is hypothetical,
model-based simulation — not a prediction or guarantee. Backtested results have inherent limitations,
past performance does not indicate future results, and trading futures carries a substantial risk of
loss. This walkthrough shows how the tool interrogates a strategy; it is not a claim that any
strategy makes money. Full guide · see the disclaimer in every report.
0/Setup — AlgoCrucible talks to your NinjaTrader
AlgoCrucible runs on your machine and drives NinjaTrader 8's own backtest engine through a small
bridge add-on the installer deploys. That matters: every number you'll see is produced by NT8 itself,
on your data, with commission and slippage modeled — not by a re-implementation that fills at prices
NT8 wouldn't.
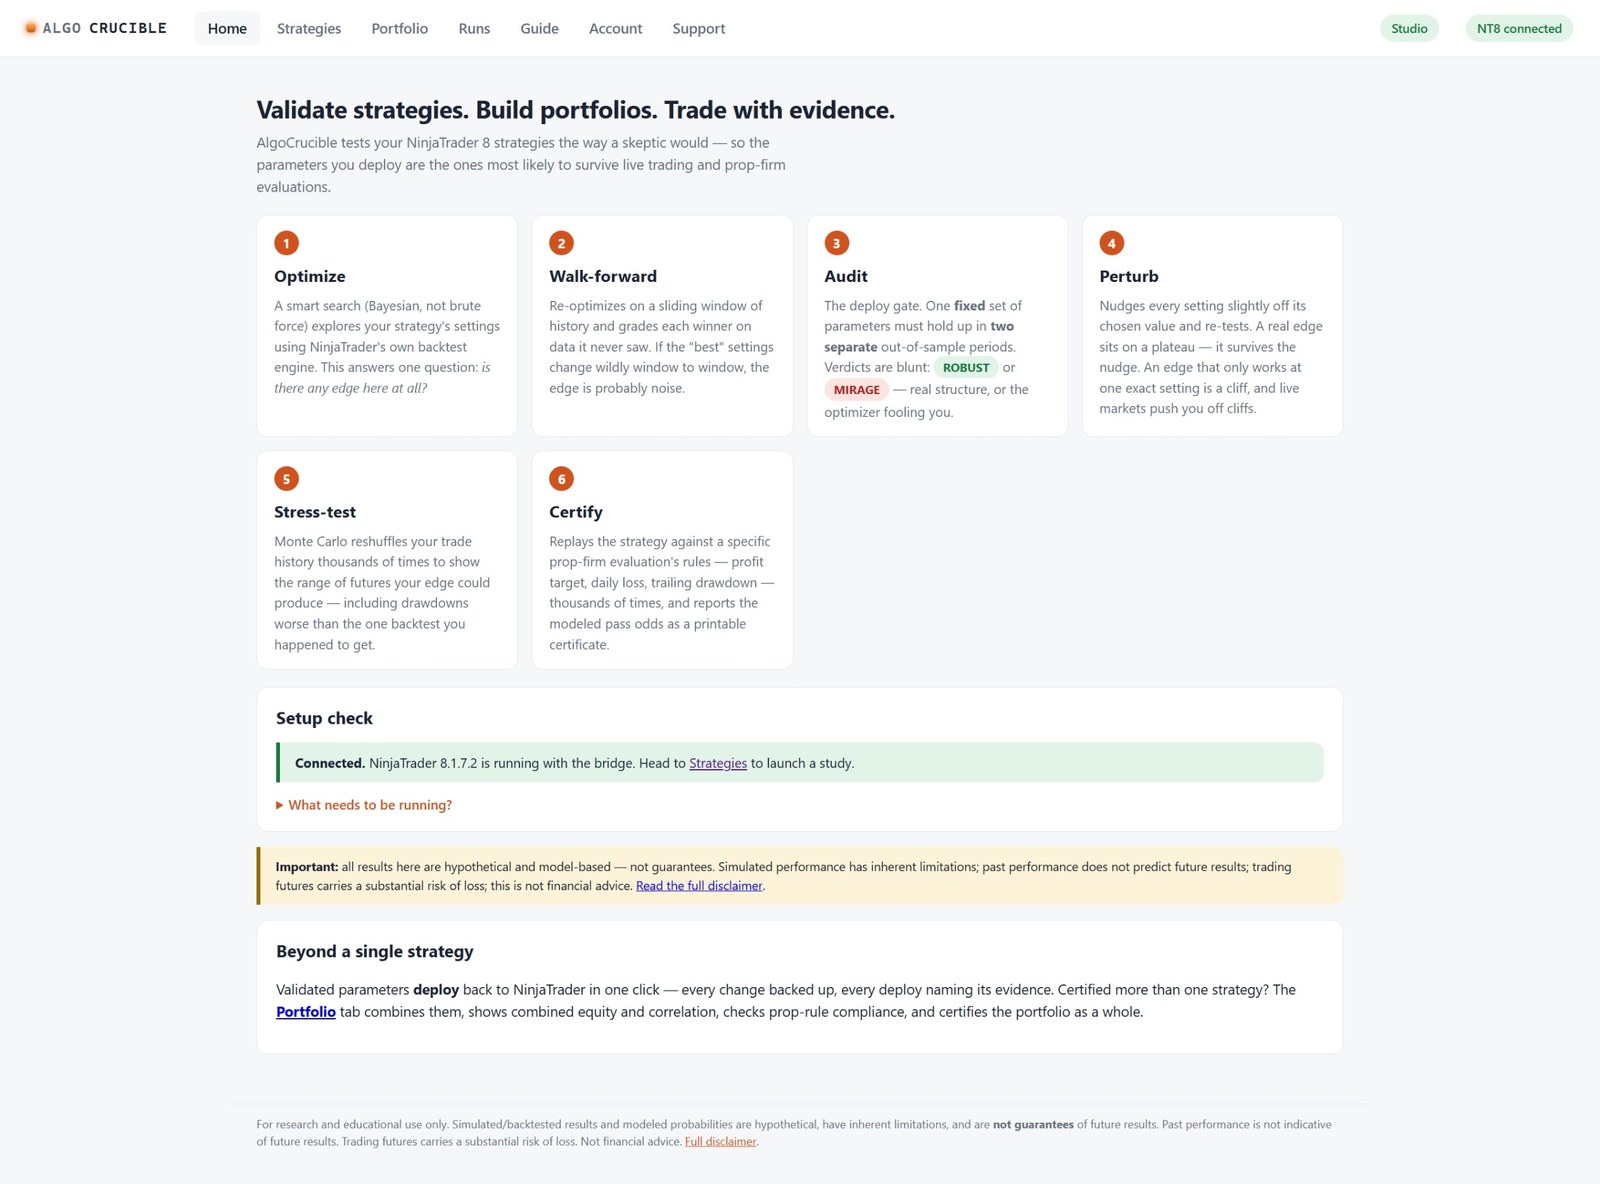
The setup check. The green banner means the bridge is loaded and a Strategy
Analyzer window is open — that's all the setup there is. The six cards above it are the funnel this
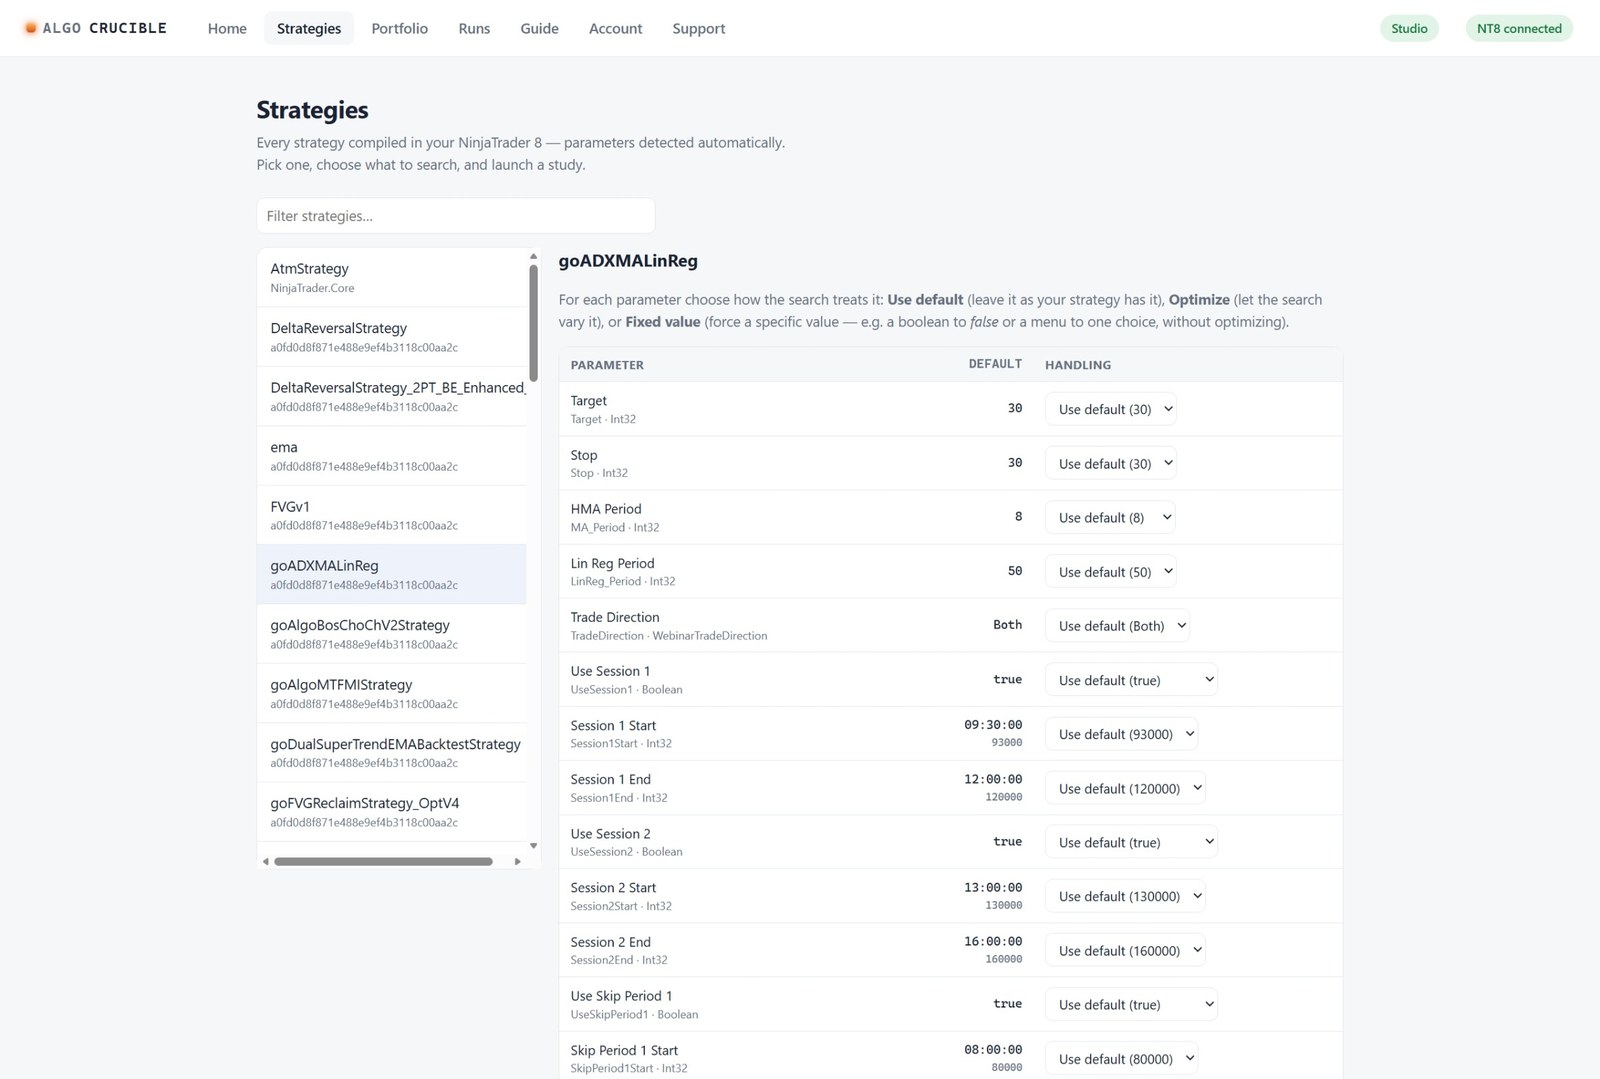
strategy is about to run.Pick a strategy. Every strategy compiled in your NinjaTrader appears here
automatically, parameters detected by reflection. We'll follow goADXMALinReg through all
six stages.
1/Configure & Optimize — is there any edge at all?
Each parameter can stay at its default or be searched across a range. Fewer free dials means less
room to fool yourself — only free the settings you genuinely aren't sure about. Here four parameters
get ranges; everything else stays fixed.
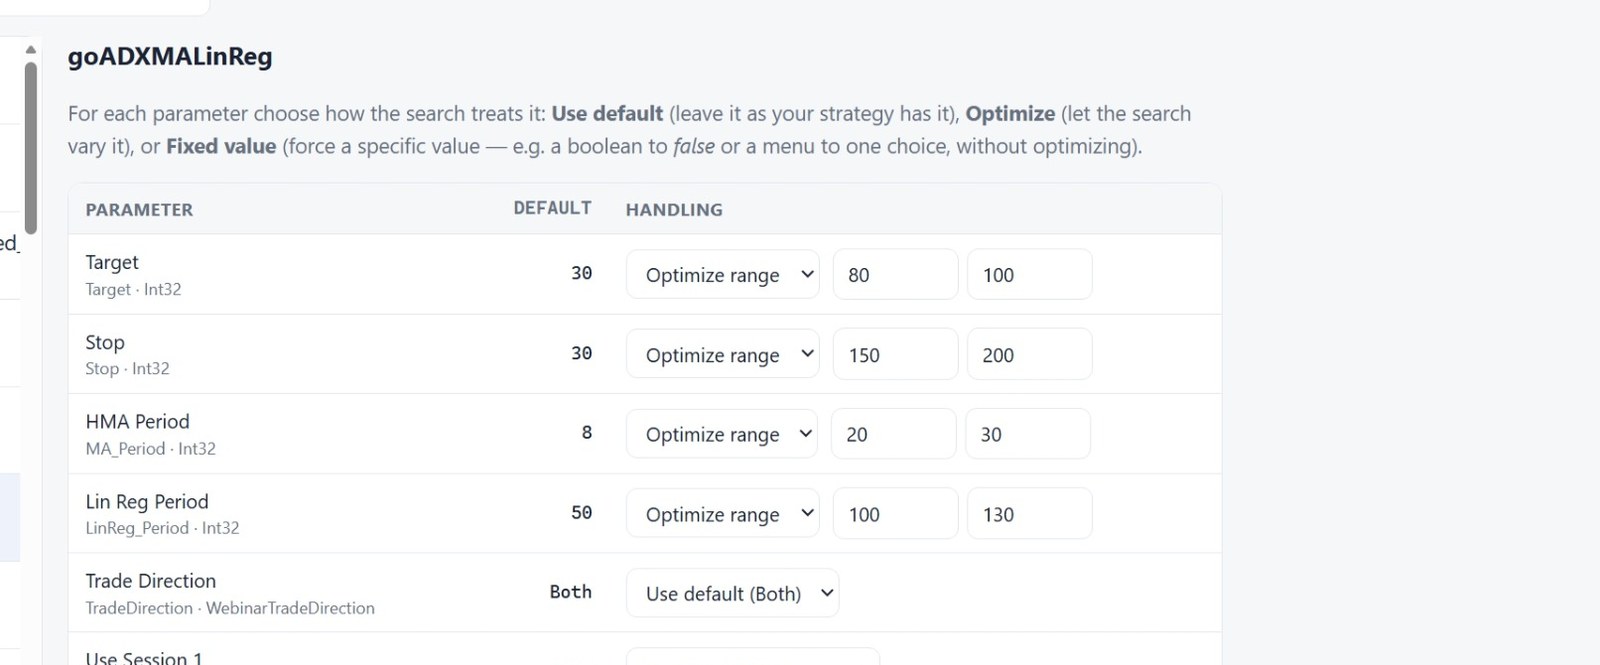
Choosing which dials the optimizer may turn. Target, Stop, HMA Period and
Lin Reg Period get ranges. The search is Bayesian (Optuna) — it samples the space intelligently
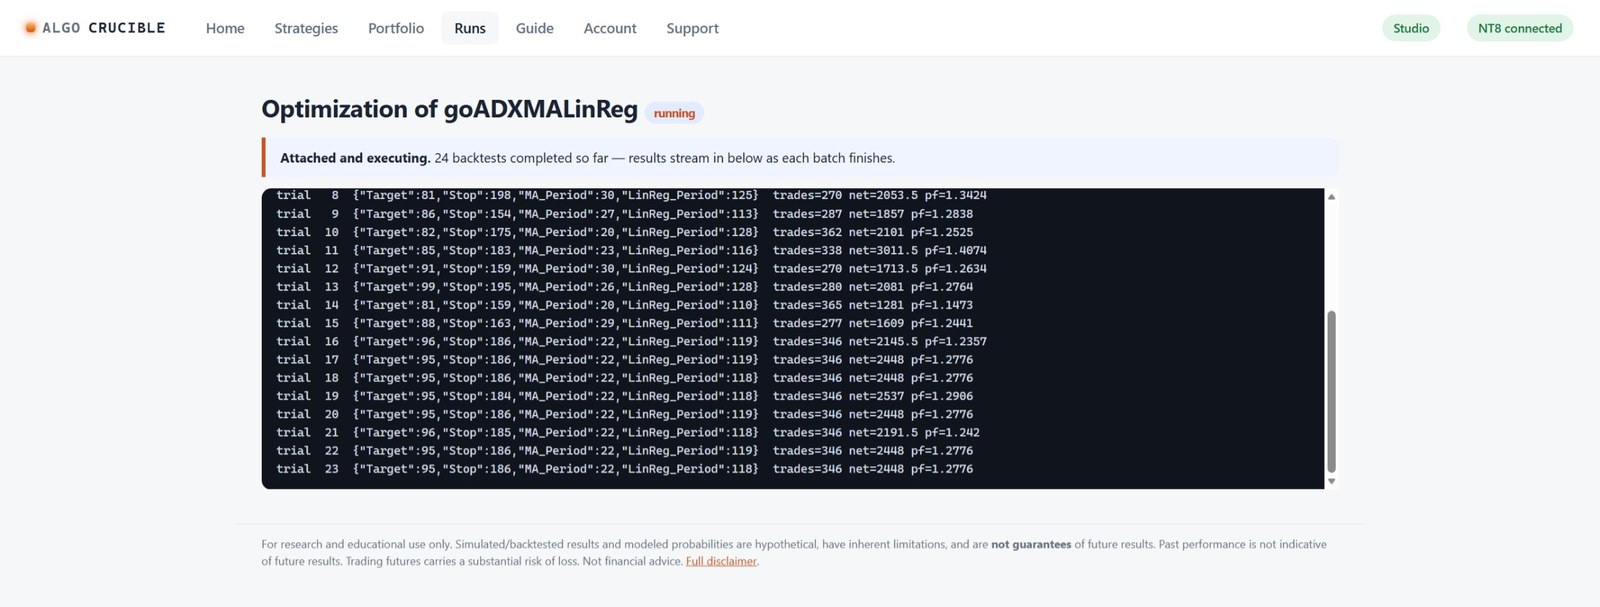
rather than stepping a brute-force grid.The search, live. Trials stream in from NinjaTrader's engine as each batch
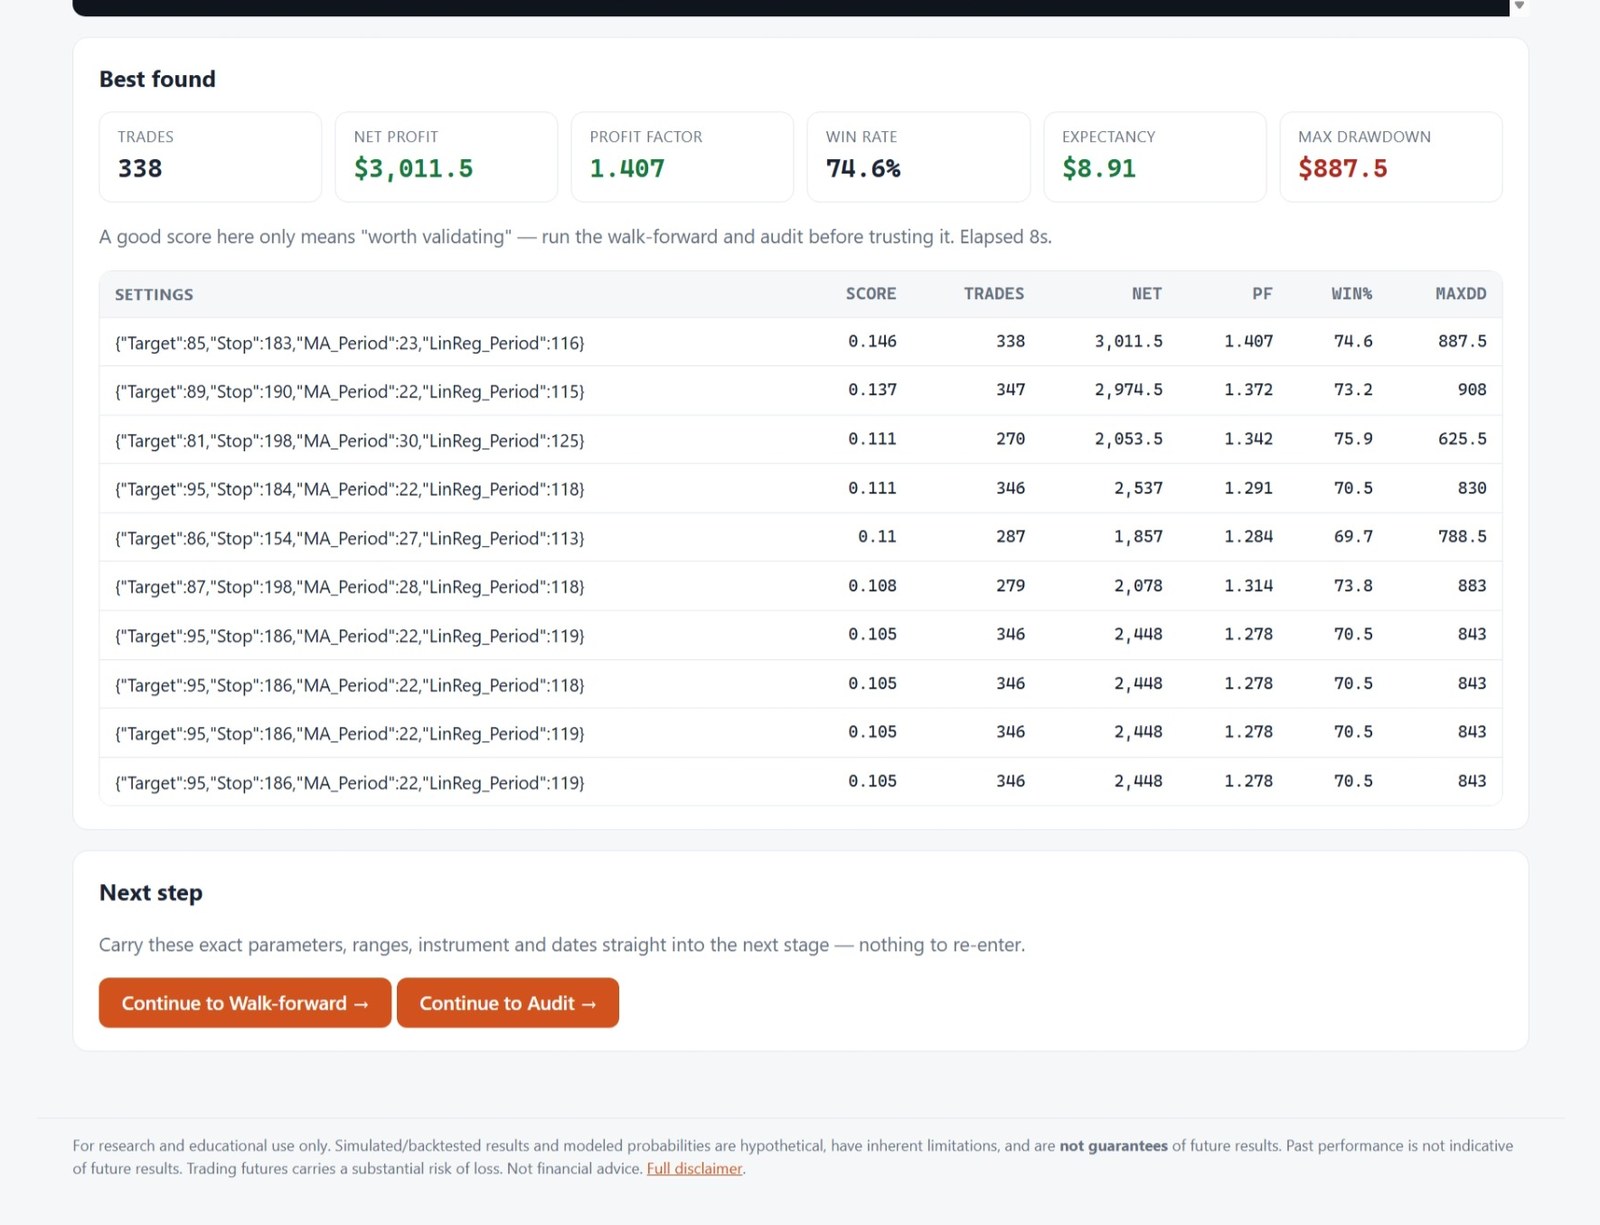
finishes — every row is a full backtest with its trade count, net and profit factor.The audition result. Best found: 338 trades, profit factor 1.407. The app
says it itself: a good score here only means "worth validating." An optimizer can always find
something that looked great in the past — the next four stages try to break it.
2/Walk-forward — does the edge survive data it never saw?
The strategy is re-tuned on one slice of history, then tested on the following slice it had never
seen — repeated across the whole data set. Only the unseen slices count toward the result. That's the
honest number, and it is expected to be smaller than the optimizer's.
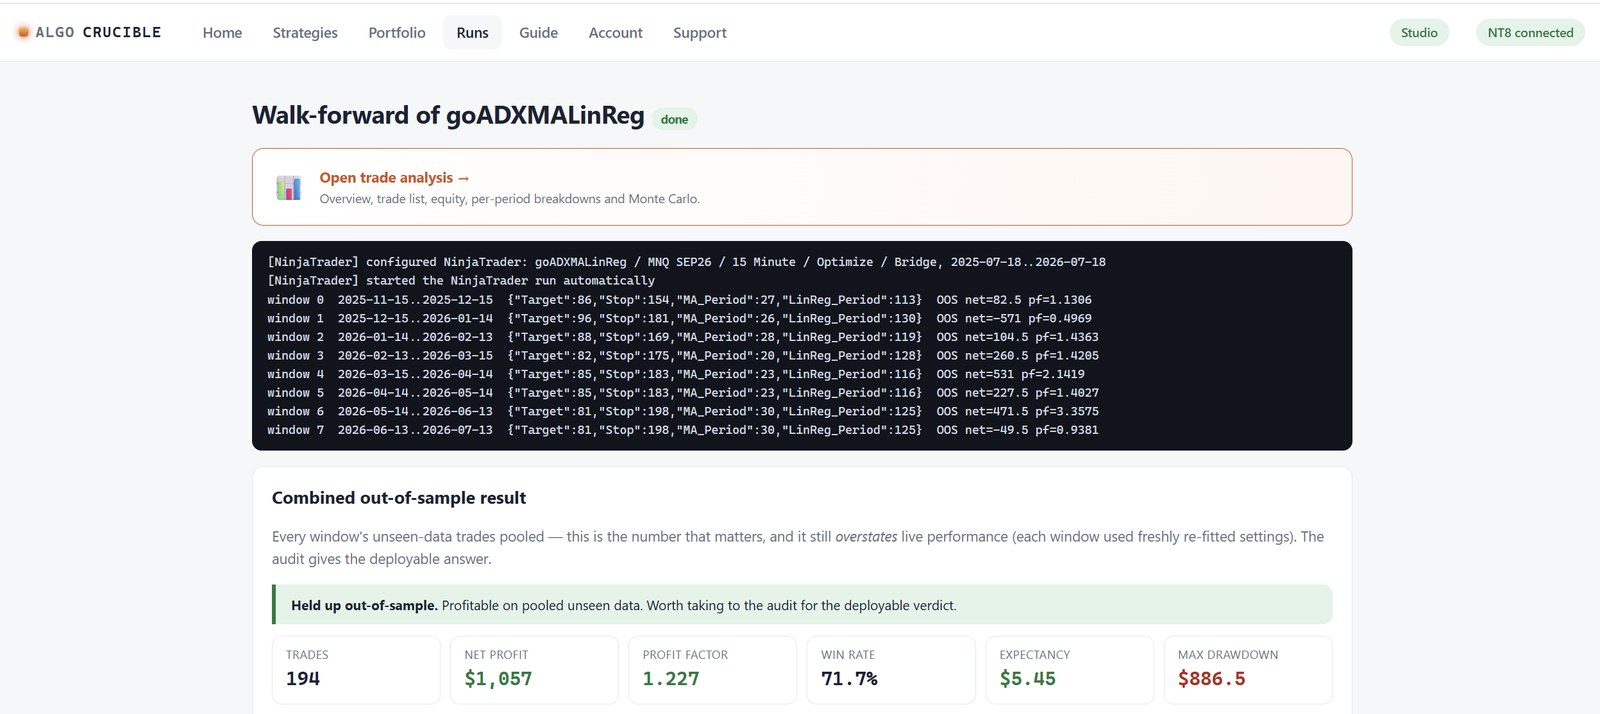
Held up out-of-sample. Eight windows, pooled unseen-data result: 194 trades,
$1,057 net, profit factor 1.227 — down from the optimizer's 1.407, exactly as an honest test should be,
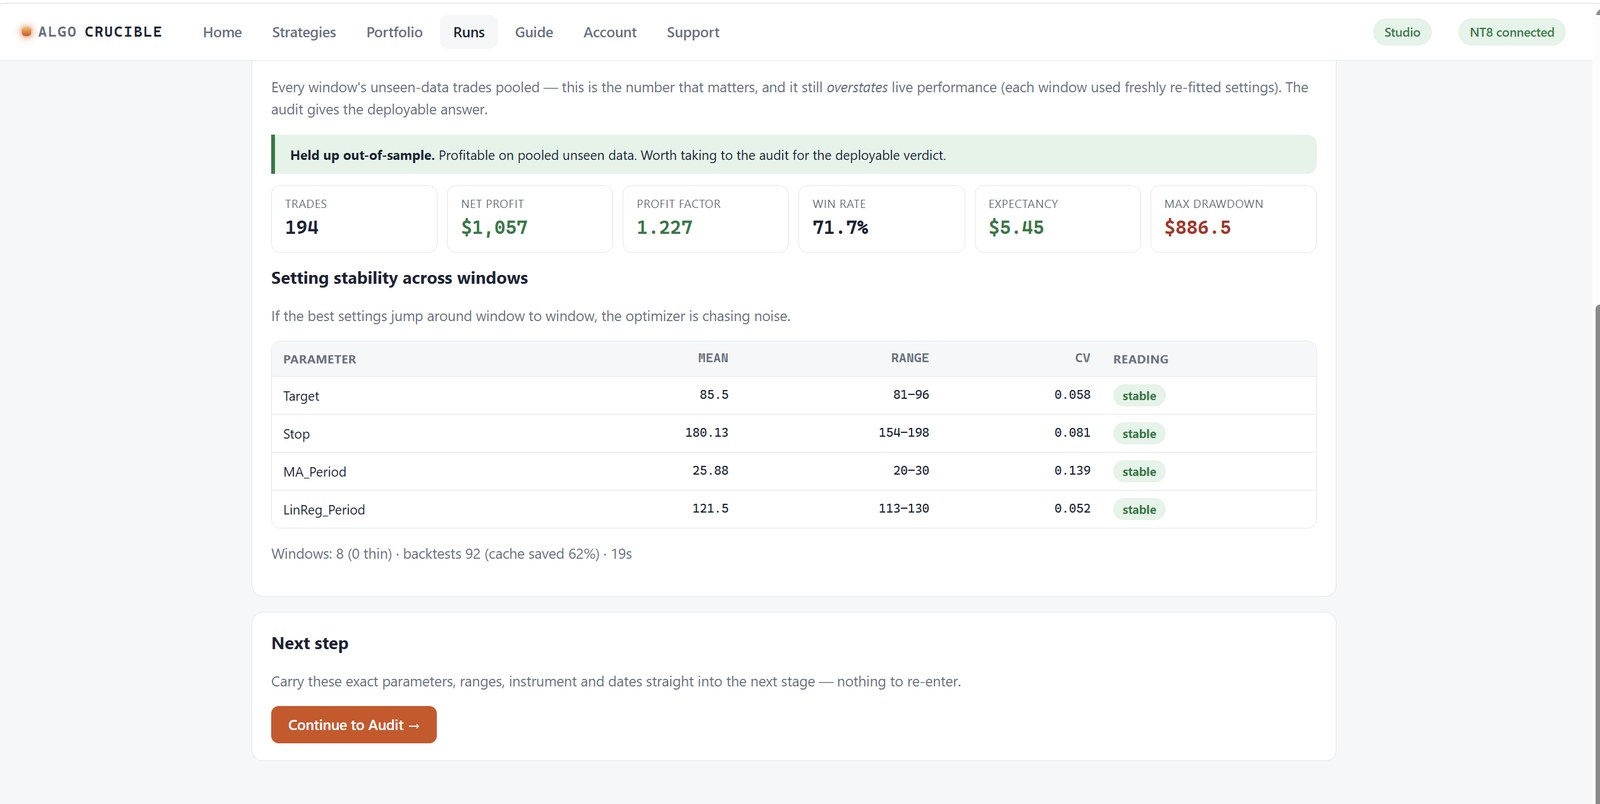
and still profitable.Do the "best" settings hold still? If the winning values jump around window
to window, the optimizer is chasing noise. All four parameters graded stable — the edge doesn't
need a different strategy every month.
3/Audit — the deploy gate
The audit freezes one parameter set and grades it on two separate out-of-sample
periods it never touched. The verdict takes the worst of the two windows — no cherry-picking. Verdicts
are blunt: ROBUST or MIRAGE.
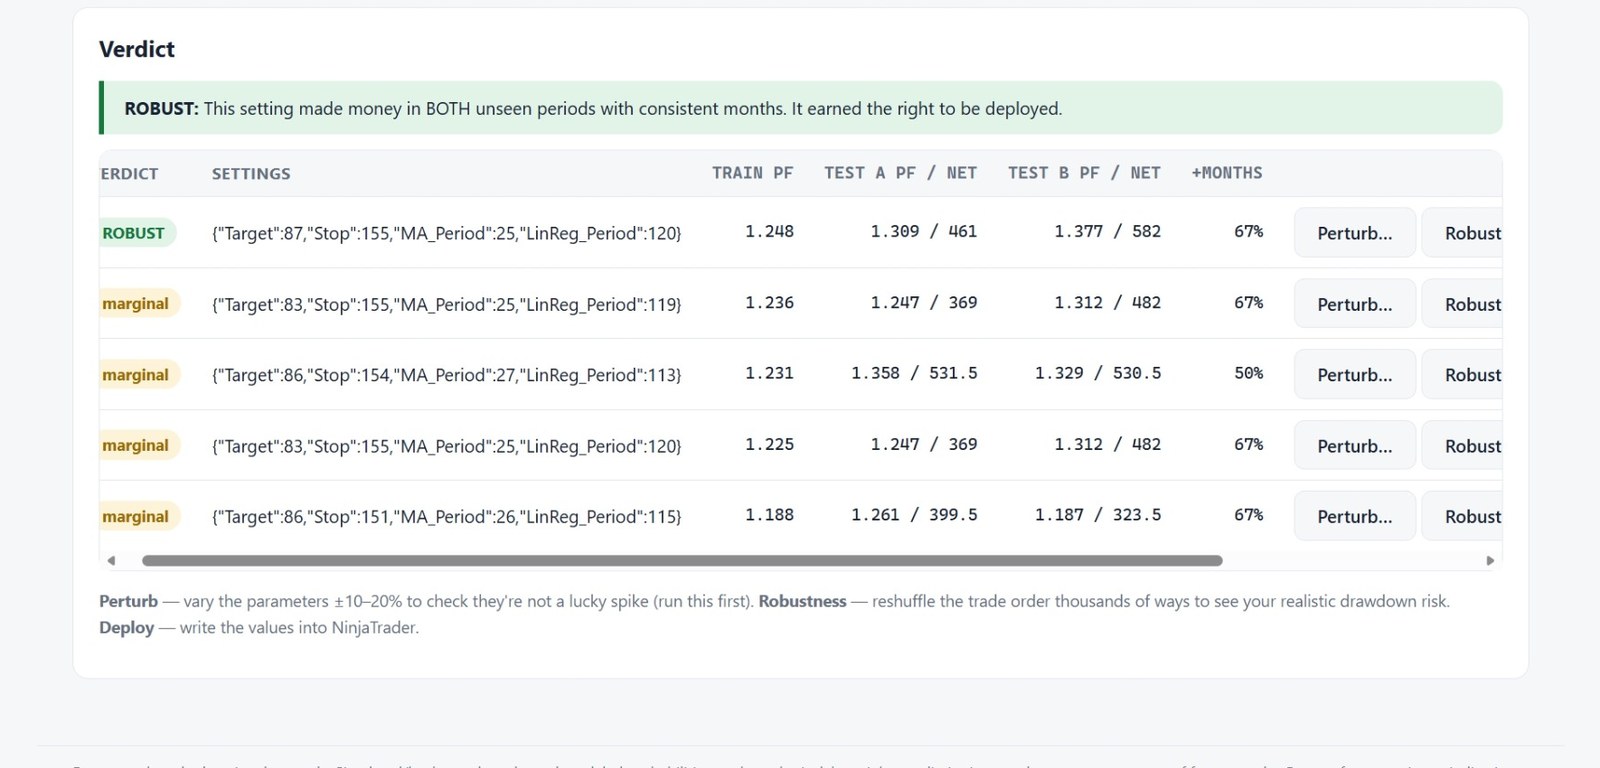
ROBUST. "This setting made money in BOTH unseen periods with consistent
months. It earned the right to be deployed." Most strategies die here — and a failure here is the tool
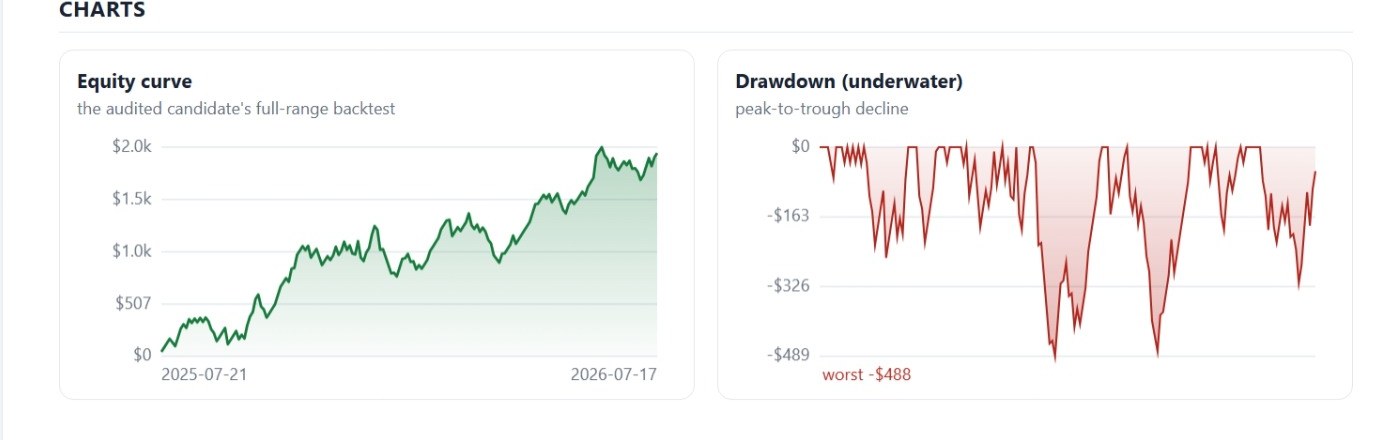
doing its job, catching a mirage before it costs real money.The road, not just the destination. The audited candidate's full-range
equity curve and its underwater chart — every decline from a peak, how deep and how long. Worst dip:
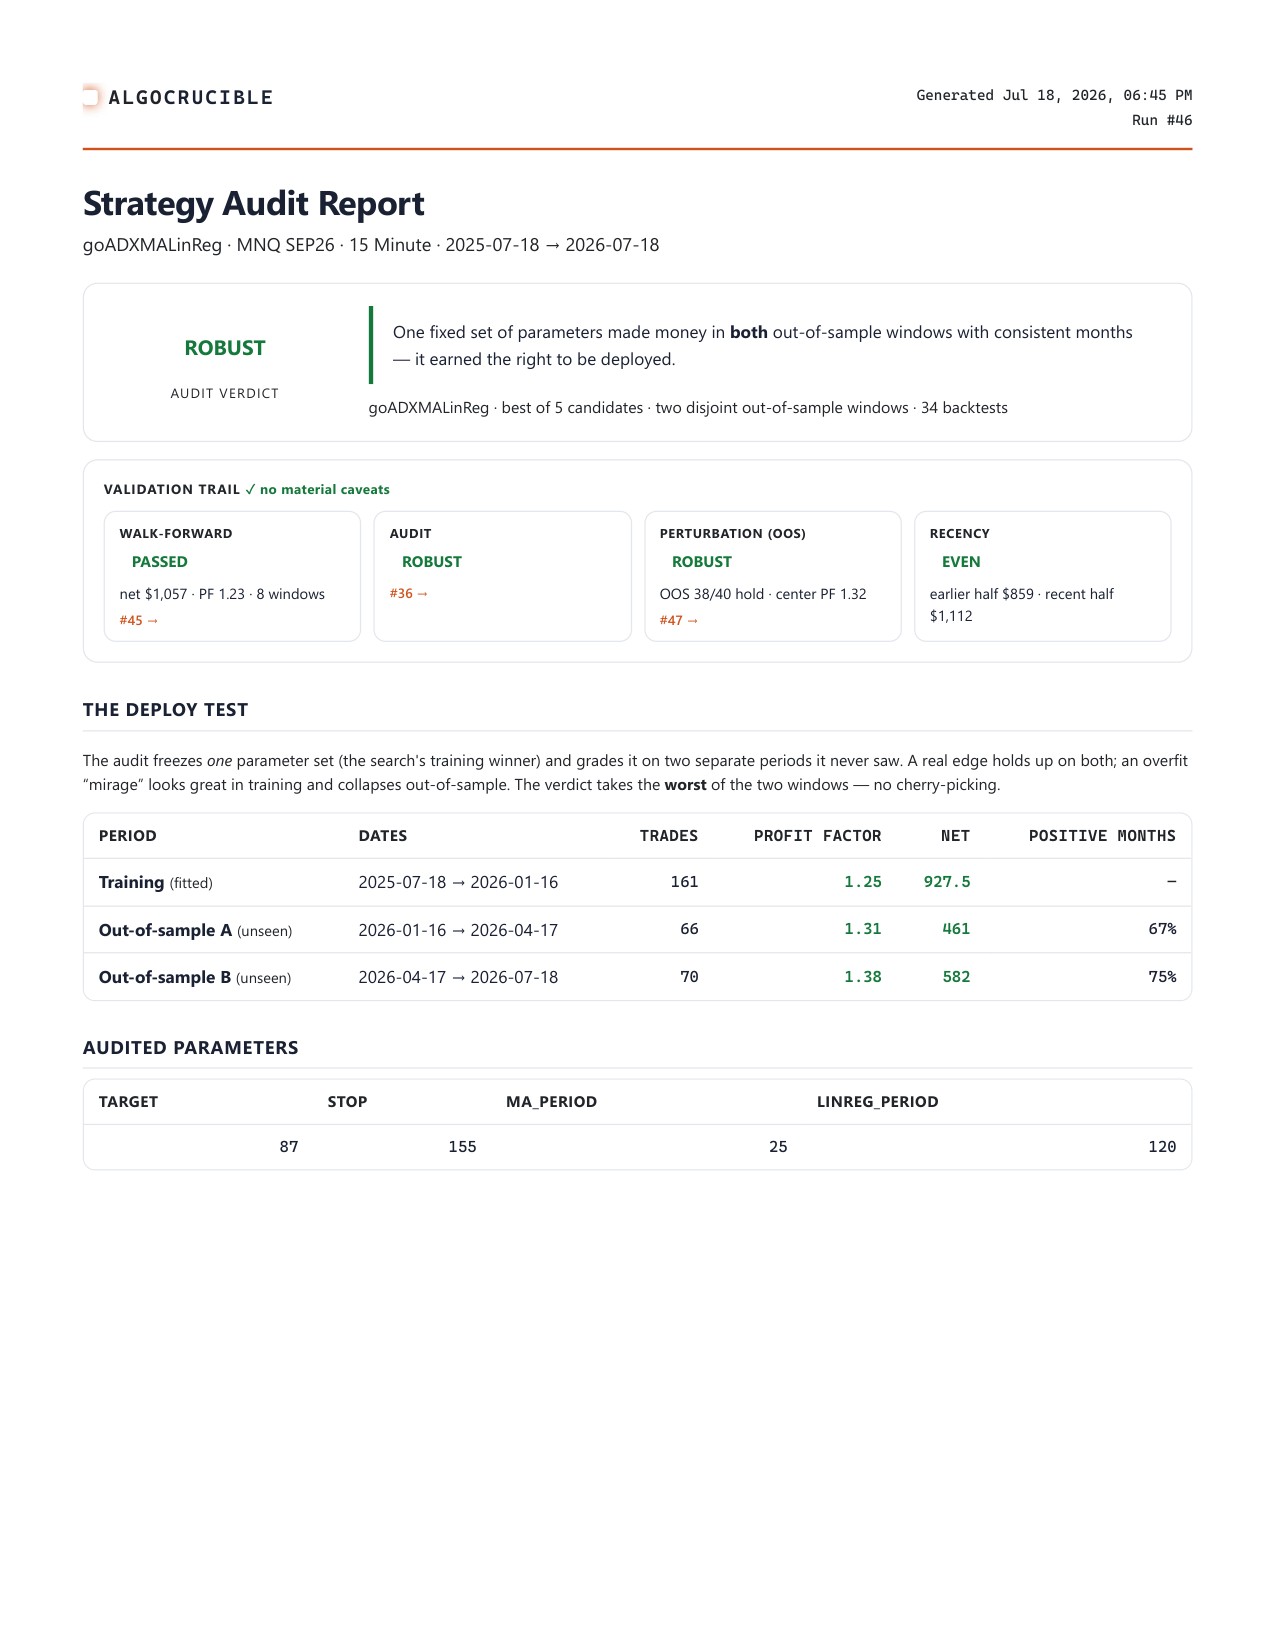
−$488.The paper trail. The audit as a shareable, printable report: what was
tested, on what data, with what settings, and the verdict — for a trading partner, a prop firm, or
future you. (Click to see the full page.)
4/Perturbation — plateau or cliff edge?
A real edge sits on a plateau: nudge every setting slightly off its chosen value and it should still
work. An edge that only works at one exact magic number is a cliff — and live markets push you off
cliffs. AlgoCrucible backtests dozens of nearby parameter sets and re-grades each on held-out data.
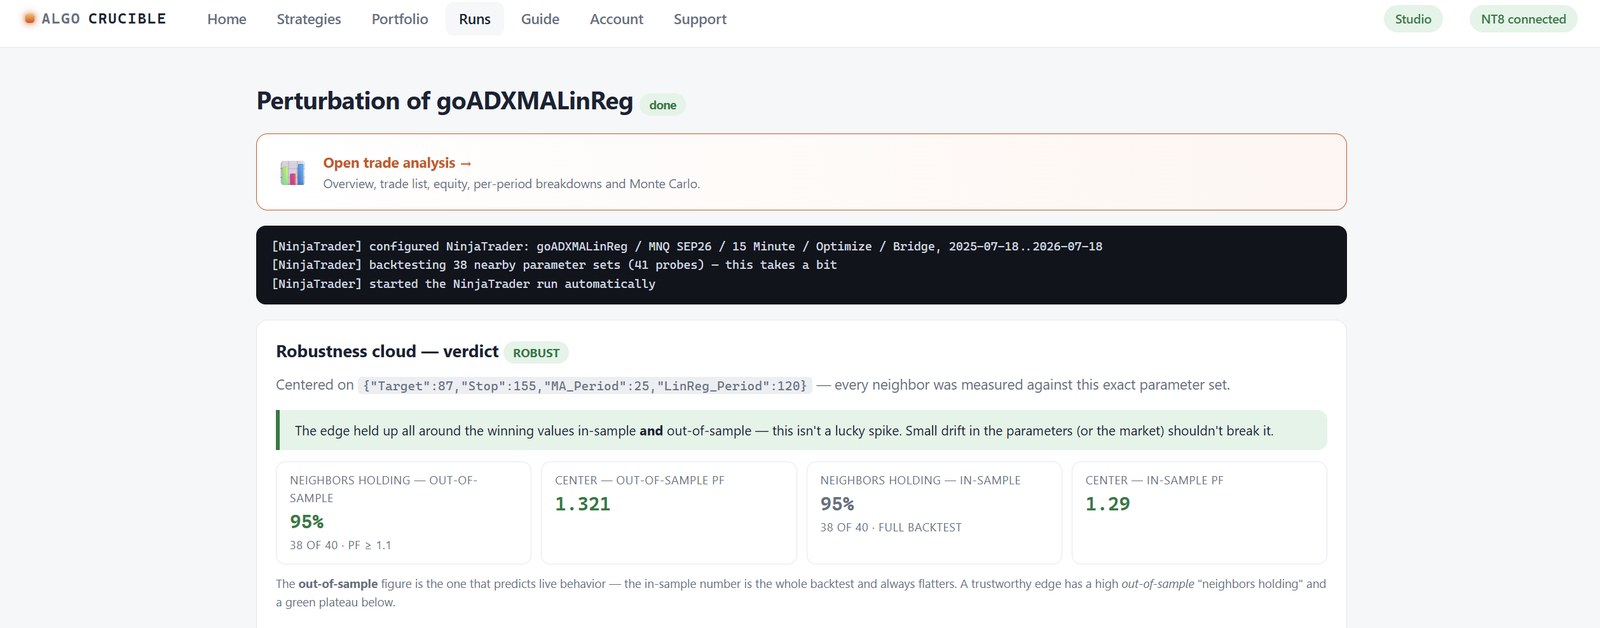
The neighborhood test. 38 of 40 nearby parameter sets (95%) held the edge
out-of-sample. "The edge held up all around the winning values — this isn't a lucky spike. Small drift
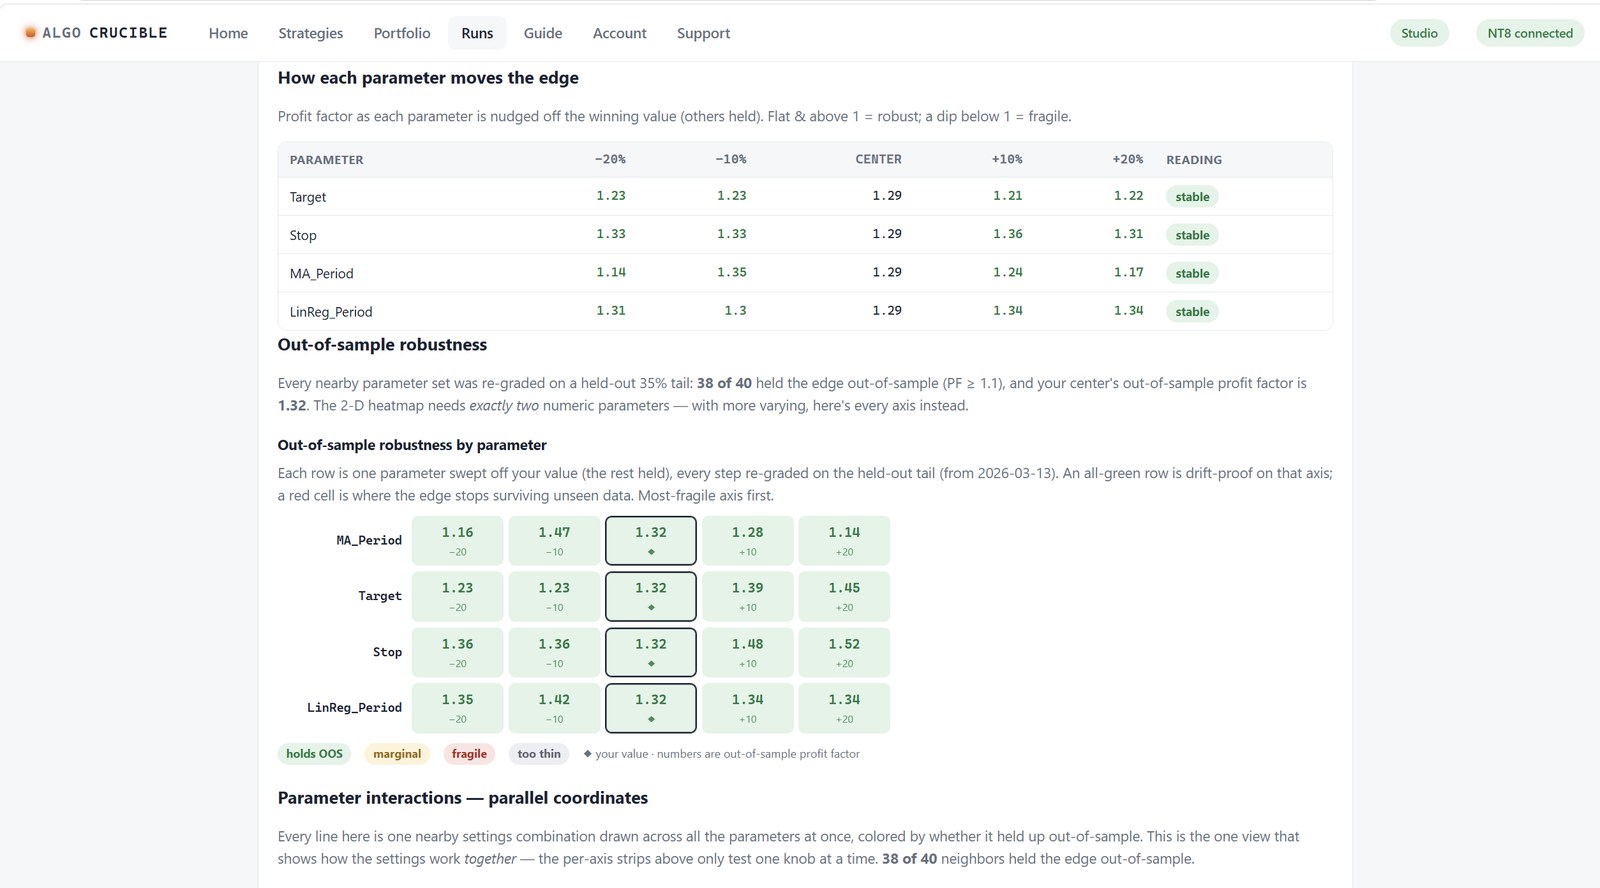
in the parameters (or the market) shouldn't break it."Which dials are dangerous? Each parameter swept ±10–20% off its value, every
step re-graded on the held-out tail. An all-green row is drift-proof on that axis; a red cell is where
the edge stops surviving unseen data. Here: green across the board.
5/Monte Carlo — what could luck have done?
A backtest is one ordering of history. Reshuffle the trade sequence thousands of times and
you see the range of outcomes the same edge could have produced — including drawdowns worse than the
single one your backtest happened to show. These are the numbers a prop firm's rules actually act on.
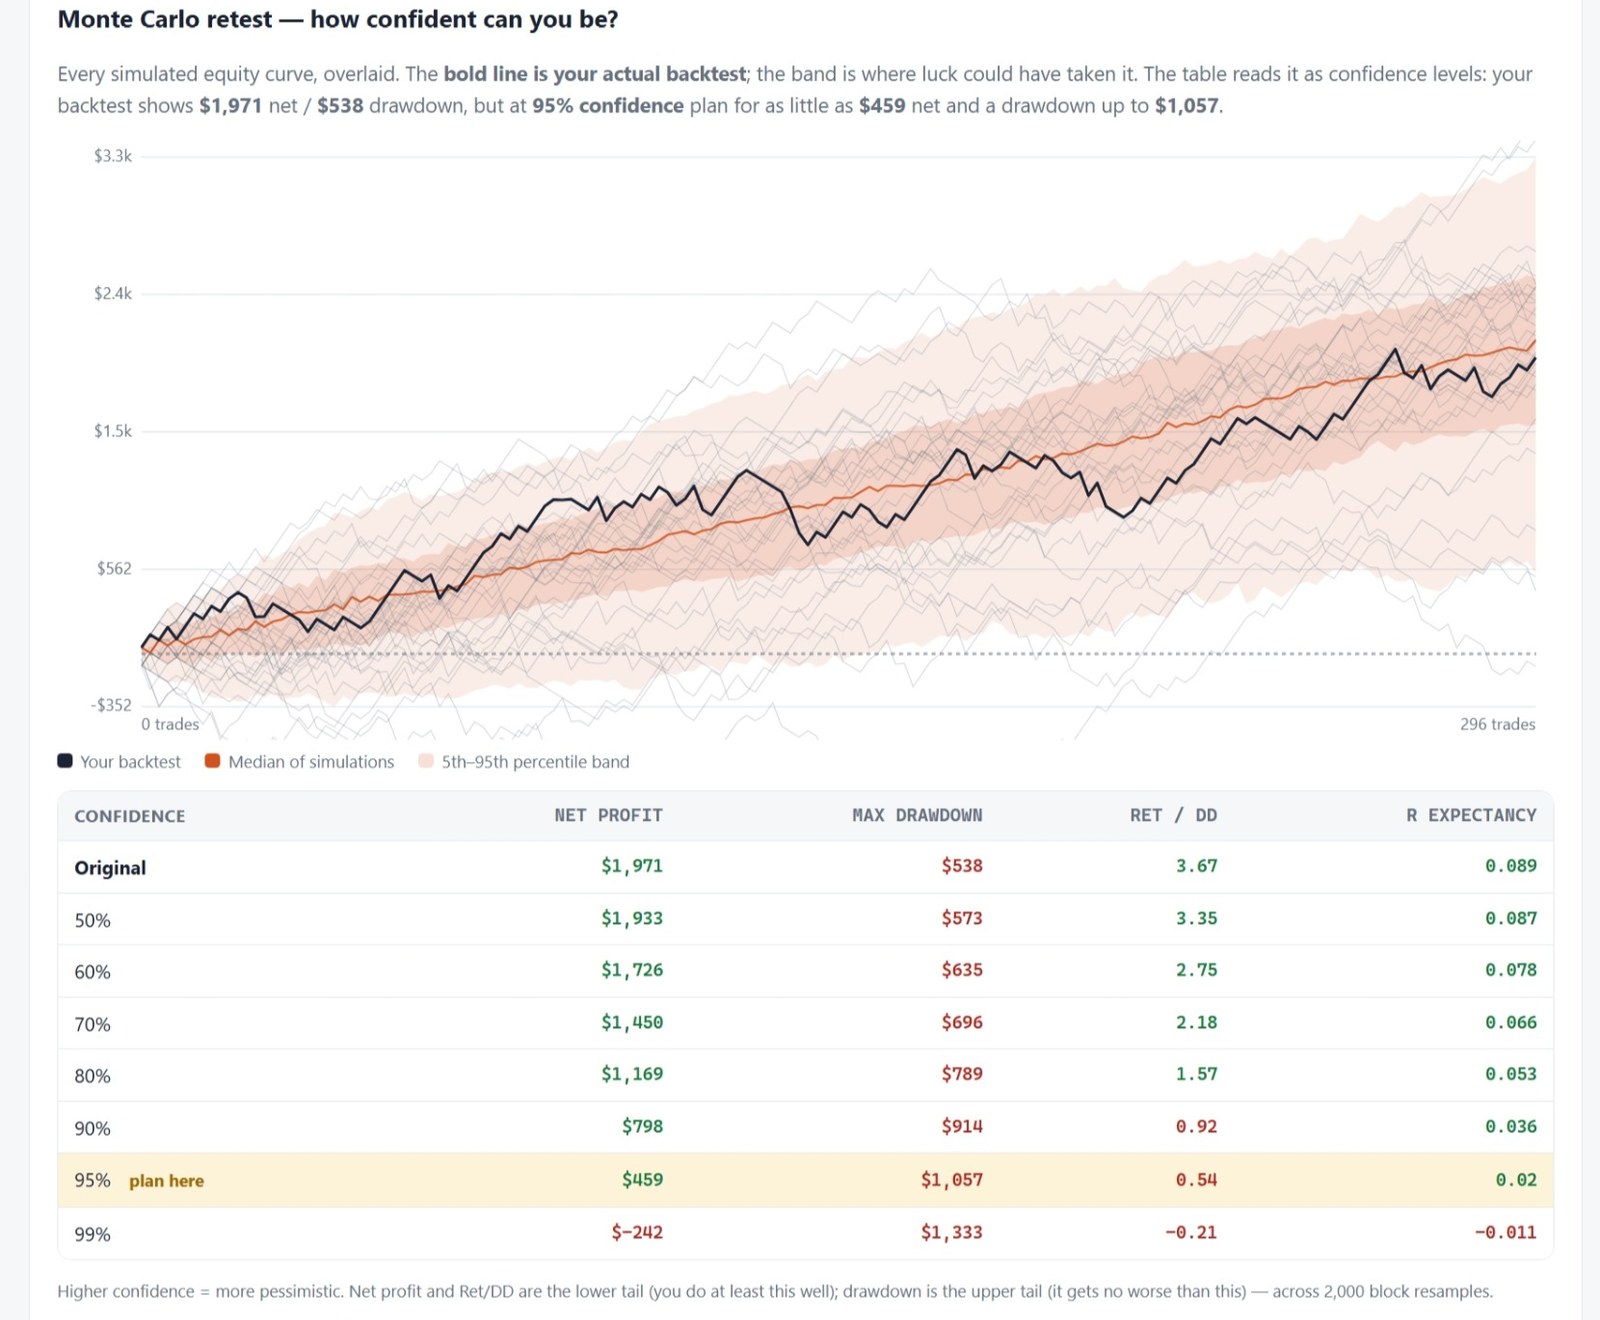
The fan. 2,000 reshuffles of the trade sequence; the bold line is the actual
backtest, the band is where luck could have taken it. The table turns it into planning numbers: the
backtest shows $1,971 net / $538 drawdown, but at 95% confidence you plan for as little
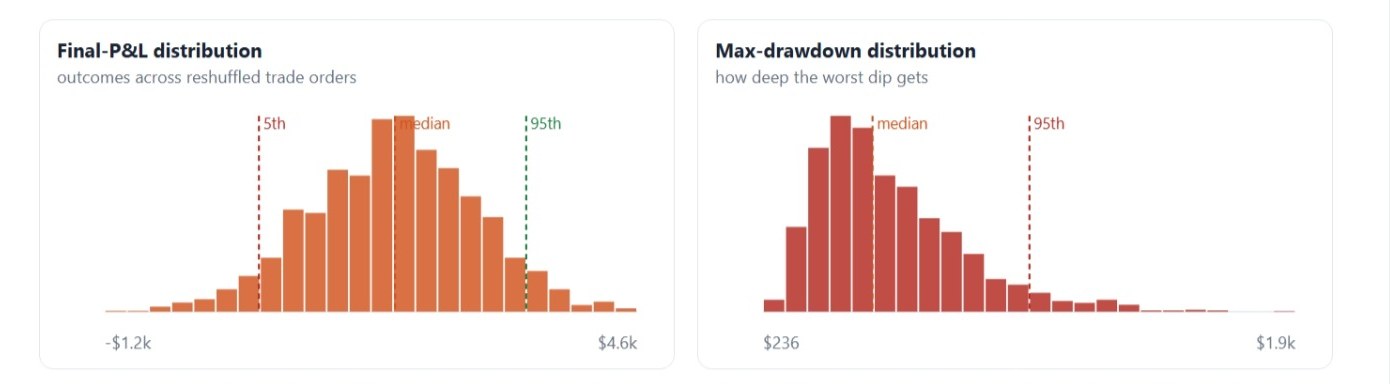
as $459 net and a drawdown up to $1,057.Size for the distribution, not the anecdote. Across all reorderings: where
final P&L lands, and how deep the worst dip typically gets. Your account — and your nerves — should
be sized for the 95th percentile, not for the single lucky drawdown one backtest showed.
6/Certification — odds against a real evaluation's rules
Now the question that started all of this: would this strategy pass a prop-firm evaluation?
Enter the evaluation you're actually facing — profit target, daily loss limit, trailing drawdown, time
limit — and AlgoCrucible steps thousands of simulated evaluations through those exact rules,
trade by trade.
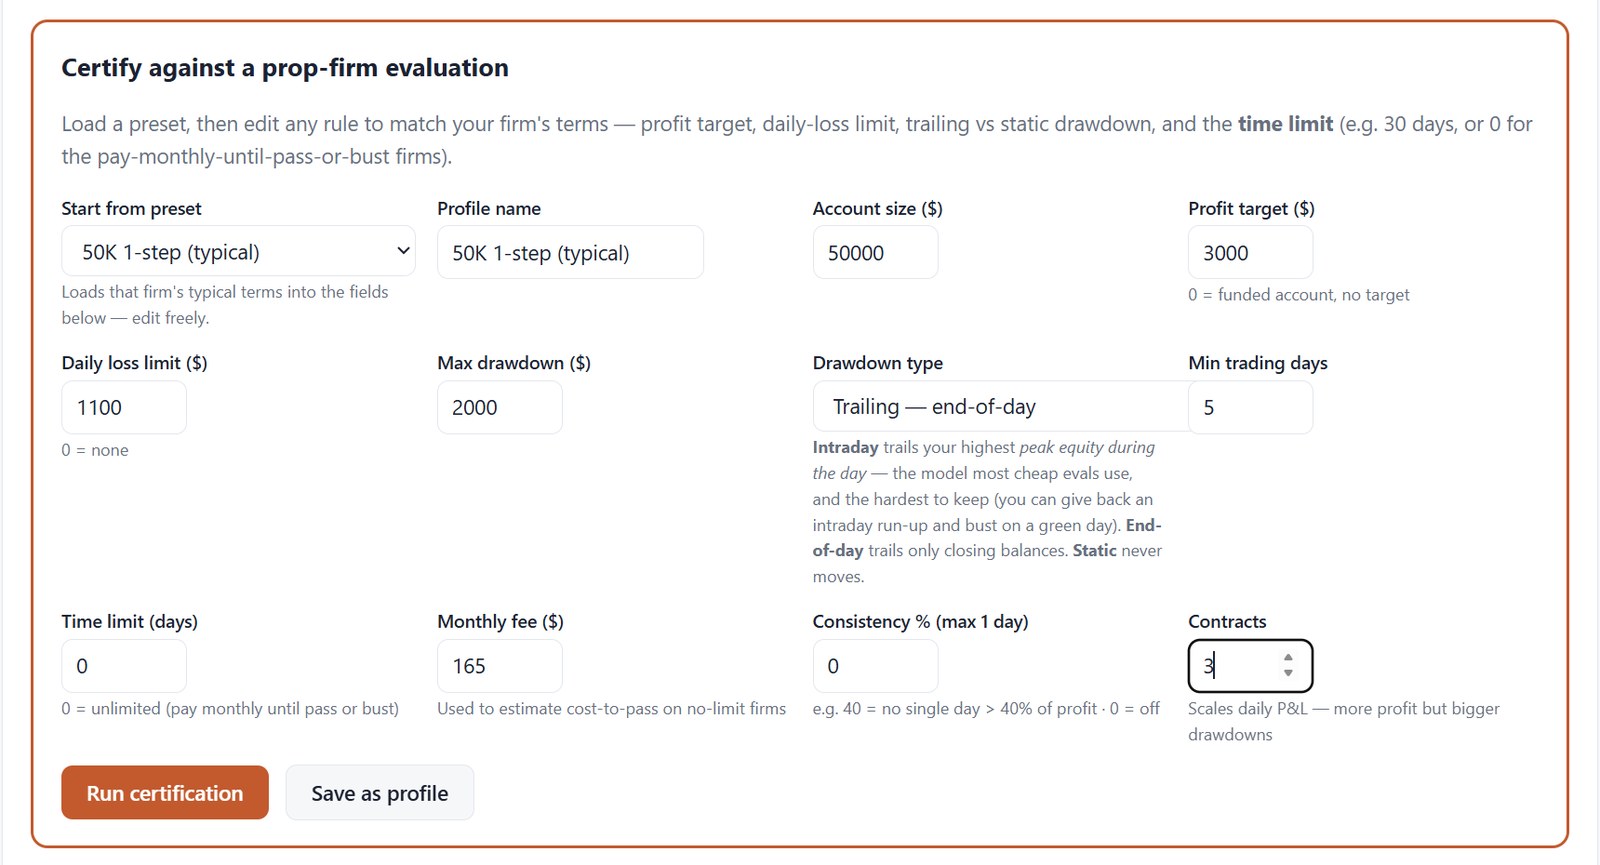
Your firm's rules, not a generic score. Load a preset, then edit anything —
here a typical 50K one-step: $3,000 target, $1,100 daily loss, $2,000 end-of-day trailing drawdown,
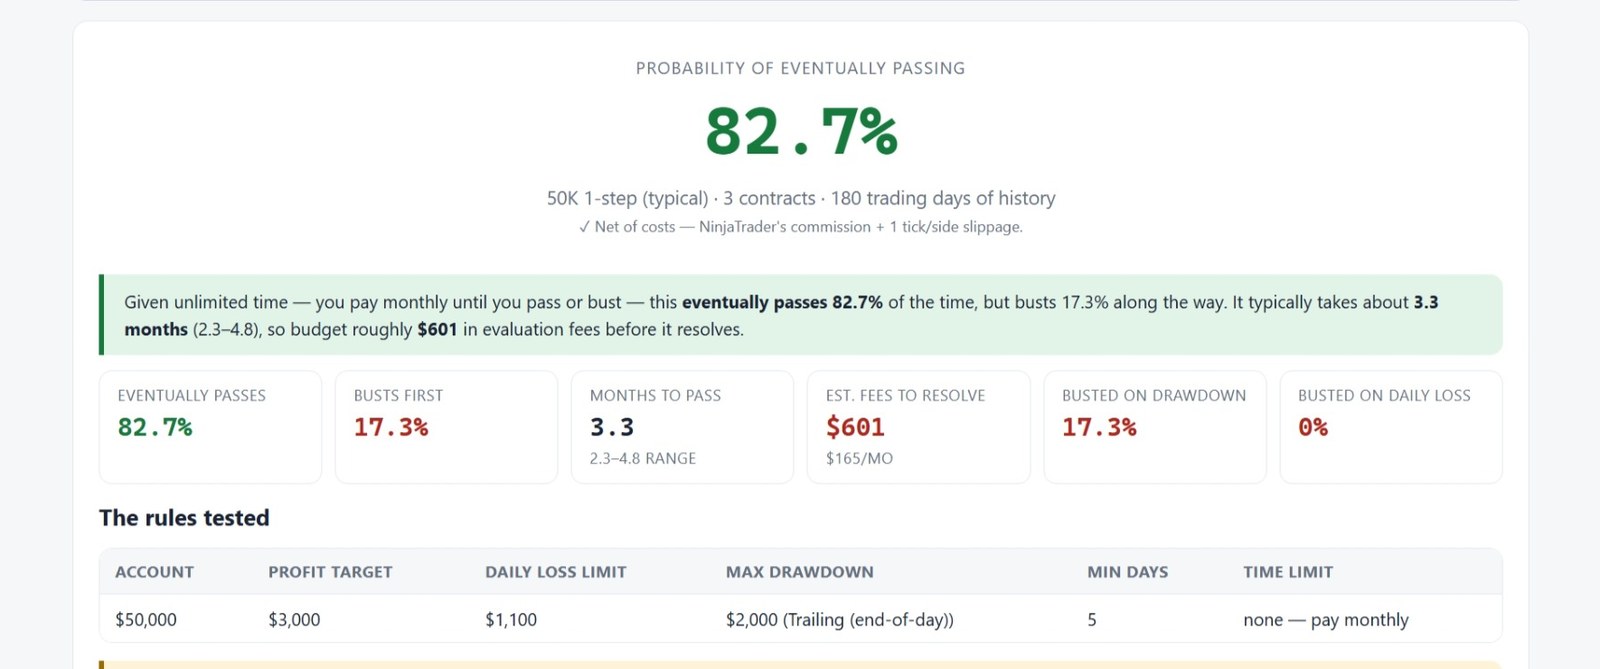
pay-monthly (no time limit), 3 contracts.The answer, with its costs. Modeled on 180 days of history: eventually passes
82.7% of the time, busts 17.3% along the way, typically ~3.3 months and ~$601 in
evaluation fees before it resolves. Every bust came from the trailing drawdown — not the daily-loss
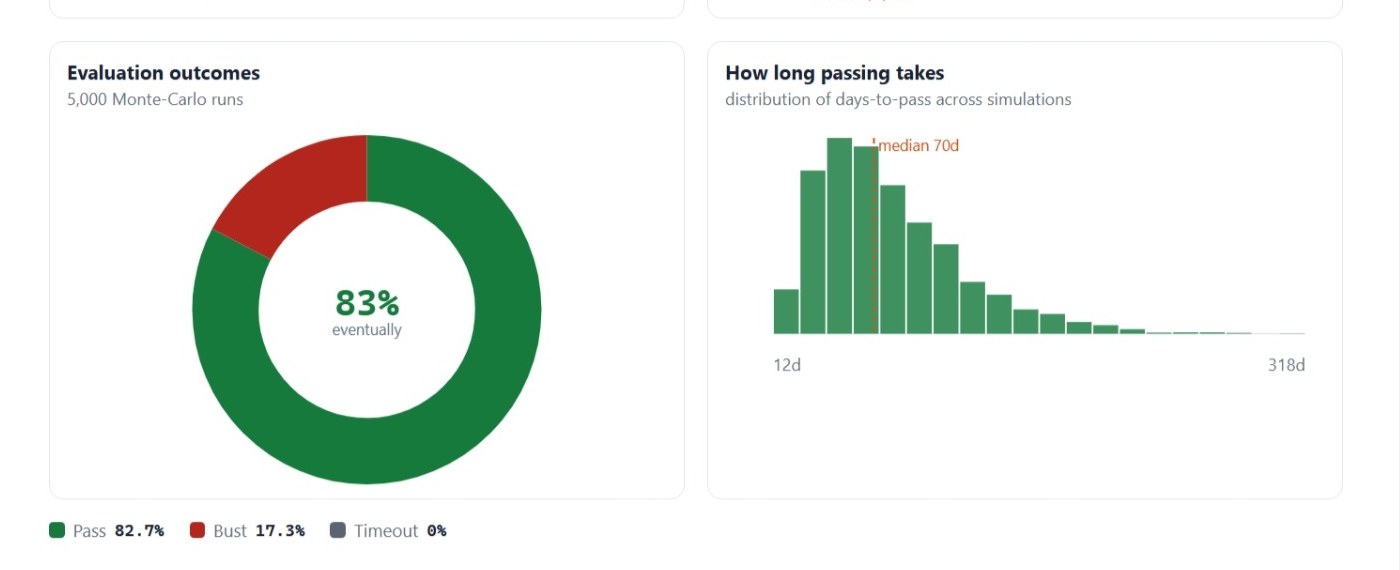
limit. Know this before paying for an eval, not after.What a normal month looks like. Outcomes across 5,000 simulated evaluations,
and — when it passes — how long that takes (median 70 trading days). This sets expectations: what's
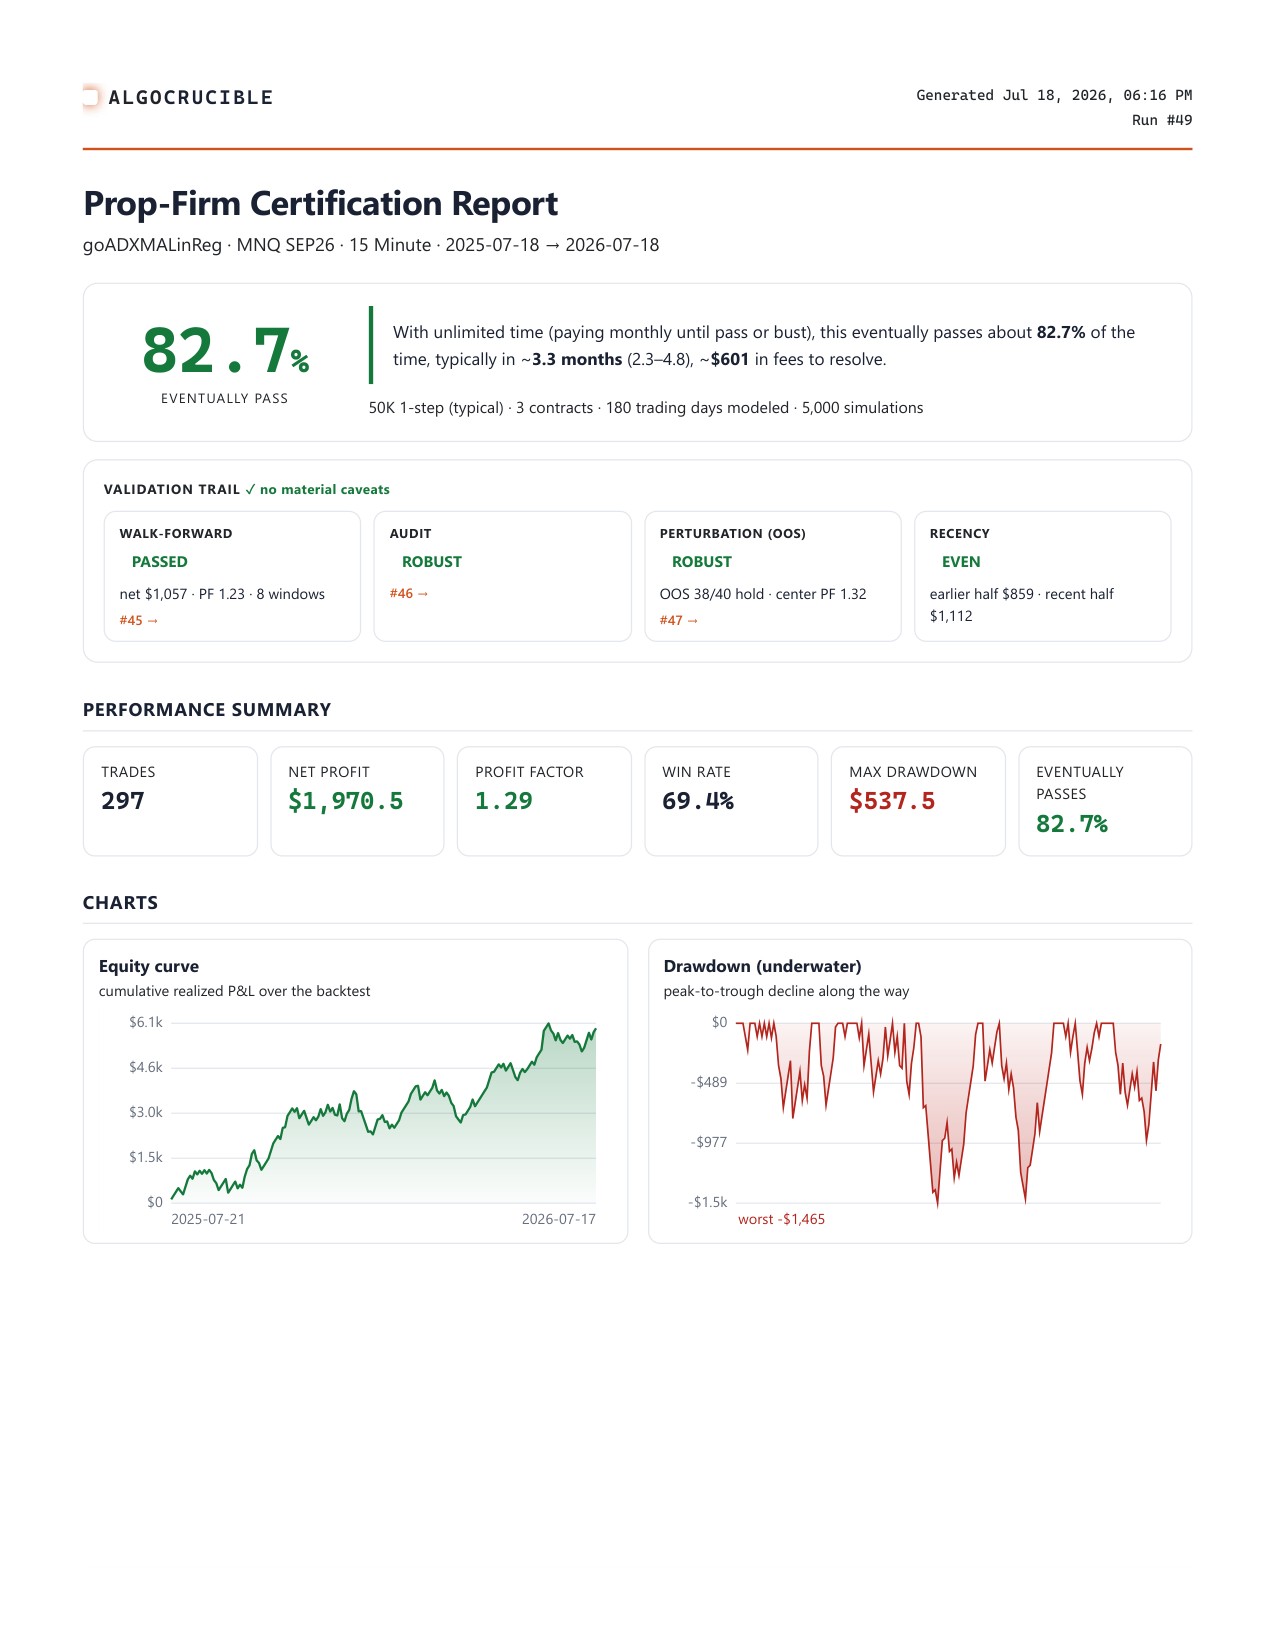
normal, and how long is long enough to suspect something has changed.The certificate. Every stage's verdict on one printable page: walk-forward
PASSED, audit ROBUST, perturbation ROBUST (38/40), the exact rules tested, and the modeled pass odds —
with the methodology and its limits stated right on the document. This is what "validated" looks like
when it's earned rather than claimed.
Put your own strategy through the crucible
The full pipeline — Optimize, Walk-forward and Audit — is free for 30 days on up to 3 strategies.
Perturbation, Monte Carlo and Certification are in the 7-day Trader trial, no card required.
Results shown are hypothetical, model-based estimates computed from limited historical
data under simplifying assumptions — not a prediction or guarantee that any strategy will be profitable
or that any evaluation will be passed. Evaluation profiles are generic models of common industry
structures, not the official rules of any firm; AlgoCrucible is independent and not affiliated with,
endorsed by, or sponsored by any proprietary trading firm or by NinjaTrader. Trading futures carries a
substantial risk of loss and is not suitable for everyone. Not financial advice.
Risk Disclosure: Futures and forex trading contains substantial risk and is not for every investor. An investor could potentially lose all or more than the initial investment. Risk capital is money that can be lost without jeopardizing one's financial security or lifestyle. Only risk capital should be used for trading and only those with sufficient risk capital should consider trading. Past performance is not necessarily indicative of future results.
Hypothetical Performance Disclosure: Hypothetical performance results have many inherent limitations, some of which are described below. No representation is being made that any account will or is likely to achieve profits or losses similar to those shown; in fact, there are frequently sharp differences between hypothetical performance results and the actual results subsequently achieved by any particular trading program. One of the limitations of hypothetical performance results is that they are generally prepared with the benefit of hindsight. In addition, hypothetical trading does not involve financial risk, and no hypothetical trading record can completely account for the impact of financial risk of actual trading. For example, the ability to withstand losses or to adhere to a particular trading program in spite of trading losses are material points which can also adversely affect actual trading results. There are numerous other factors related to the markets in general or to the implementation of any specific trading program which cannot be fully accounted for in the preparation of hypothetical performance results and all of which can adversely affect trading results.